Two resources you might be interested in

First up: Salary Survey

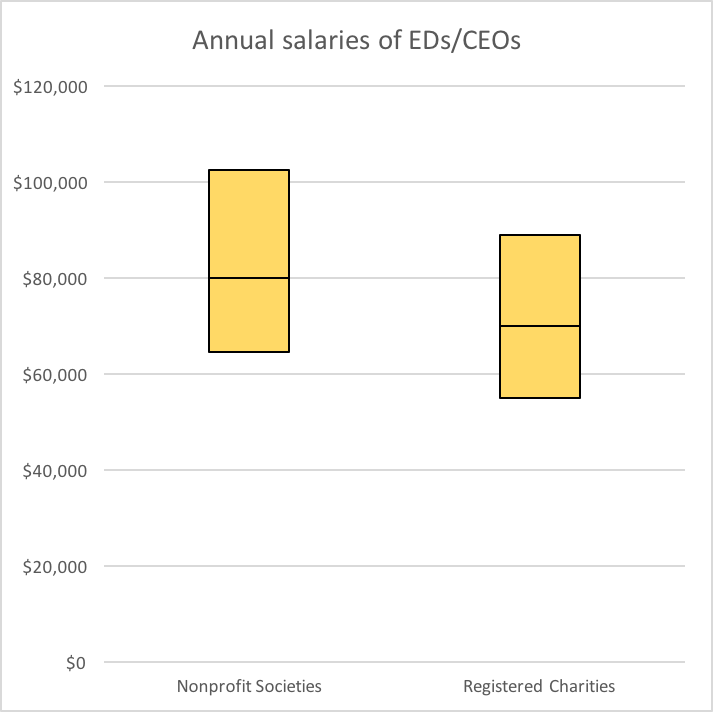
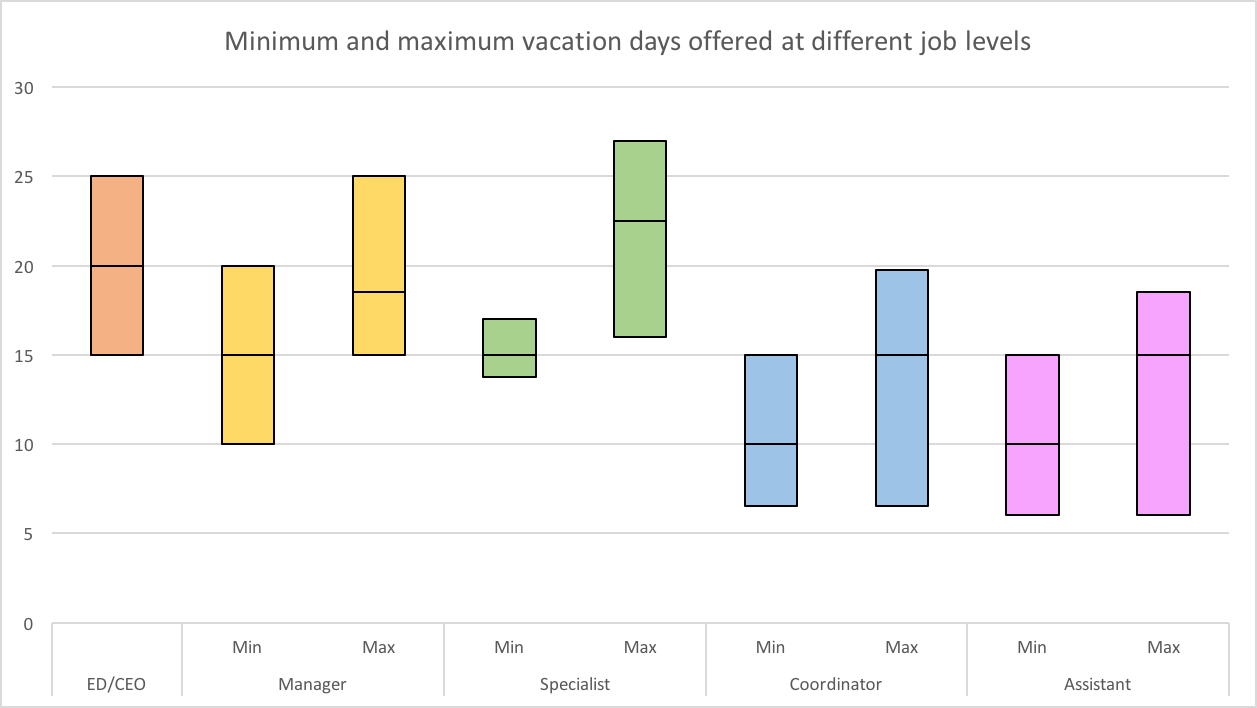
Last year I compiled salary and compensation data from over 100 organizations in Metro Vancouver. Hyper-local compensation data broken down by organization budget, and as many position types and subsectors as I could while keeping confidentiality. I released the report late last year but I neglected to share the final report with my website followers. If you use the code IMAWESOME you can get 20% off.

Find the 2016 Metro Vancouver Nonprofit Sector Salary Survey here.

What do purchasers say they find helpful?

  • “Local, current data.”
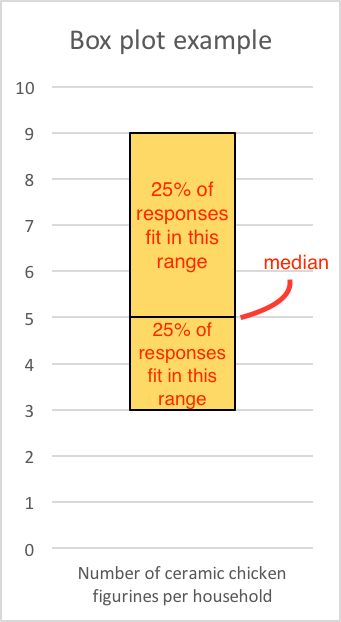
  • “The quartile benchmarking for non profits of different sizes. It totally helped me gauge whether our salaries were competitive and which positions’ compensations needed to change as a result.”
  • “Salary categories with differing organizational budgets; excellent work for the cost charged – THANK YOU!”
  • “I especially appreciated the segmented data for arts and culture organizations. This will come in very handy for our organization as we begin a transition process for some senior leaders.”
  • “It was a major force in renegotiating my contract with confidence and grace. Thanks for your hard work.” 

Next: Network building for introverts

I’m working on an e-book with the working title The Introvert’s Guide to Building Networks: an anti-networking manual.

If the idea of networking has never really resonated with you, I’d love to hear your input on the draft so far. I’ve completed sections on being strategic, events, and meetings/gatherings. The draft is open for comments–feel free to add yours!

Bonus: Race in the nonprofit sector

Nonprofits have to face biases about who is qualified to lead and why. (Race to Lead)

I’ve been doing a lot of personal and professional reflection on race and diversity lately, and really appreciated the Race to Lead report from the Building Movement Project. I’ve only got through the key findings so far, but the full report looks to be a valuable and timely read. The report is free and easy to download.

Nonprofits have to transfer the responsibility for the racial leadership gap from those who are targeted by it (aspiring leaders of color), to those governing organizations. (Race to Lead)

That’s it! Enjoy.

Metro Vancouver Salary Survey – ED/CEO annual salaries

It’s time for the final raw data reveal before the survey deadline on July 31! This week: executive director salaries!

I previously shared data on the types of organizations that had responded so far, the commonality of different types of benefits offered, and number of vacation days provided.

If you are responsible for compensation data at your organization and haven’t filled it out yet, you can find out more info and fill out the survey here.

Before I give you this week’s data, your help with one final push would be greatly appreciated!

I’d especially like to hear from (tell your colleagues! sample text below):

  • organizations outside of the City of Vancouver
  • organizations that focus on community development and housing, law/advocacy/politics, sports and recreation, or religion
  • foundations/funders
  • organizations with an annual operating budget of over $5 million

Disclaimer

If you didn’t read last week’s post about box plots, read this first. I give an explanation about box plots, and explains why I haven’t added whiskers at this time.

As stated in previous posts, the information on salaries that I share below is only meant to inspire curiosity and is not good for any decision making. The information is not disaggregated by organization size or any other identifier—it lumps all organizations together and is based on submissions to date. The data quality has not been validated. Finally, I have not provided any analysis or context.

Salaries of EDs/CEOs paid annually

For organizations with EDs/CEOs as staff (not independent contractors), they were asked to provide salary information. Some EDs are paid hourly and are not included in the following chart.

While I refer to this group as EDs/CEOs, actual titles may differ (e.g. managing director).

For today’s post I separated nonprofit societies from registered charities. Note that charities are also nonprofits, but the data for nonprofits represents organizations that are nonprofits and NOT ALSO registered charities.

Box plot companies. Details follow.

The median annual salary for nonprofit EDs is $80,000, while the median annual salary for registered charity EDs is $70,000. Fifty percent of nonprofit ED salaries fall between $64,500 and $102,500. The other fifty percent fall above and below this range. Fifty percent of registered charity ED salaries fall between $55,000 and $89,000.

Final note

Data validation once the survey closes is going to take some time. Thank you to folks that read instructions closely. Apologies to those who found the details unclear. You may hear from me to check on some of your data.

Will you share please?

Share on FB/Twitter/LinkedIn: (sorry, you’ll have to trim for Twitter )

Fellow Vancouver NP leaders! One more week left in the local salary survey, please participate so we have good data to make our salary/compensation decisions! https://trinaisakson.com/research

Send an email:

Hi _______,

Have you participated in the local nonprofit salary survey going around? I’ve participated and want to make sure there is good comparison data so that we can make good salary and compensation decisions. The deadline is July 31, so one more week to go! This survey is focused only on Metro Vancouver so the data will be especially relevant to us. More info about the survey and the link to participate is at https://trinaisakson.com/research.

Metro Vancouver Salary Survey – vacation days

It’s time for another raw data reveal. This week: vacation days!

I previously shared data on the types of nonprofit and charitable organizations that had responded so far, and the different types of benefits offered.

Reminder, survey deadline July 31! FAQs and survey link here.

This week is fun because I get to play with box plots!

When sharing salary and compensation data there are a variety of numbers that could be shared, and I’m choosing to share numbers using a special kind of chart called a box plot. Data nerds may be wondering why I’m not sharing the whiskers, and the short reason is I haven’t done data validation yet and there are a few outliers that would make really long whiskers.

Why a box plot? Because averages are (often) the devil. Outliers that are really high or low can skew the numbers. Instead, medians are the way to go in this case.

Please explain this ‘box plot’ you speak of

Example of a box plotInstead of using averages, the box plot focuses on the median, which is the middle number if all numbers are all lined up in numerical order.

In a the ‘box’ of the box plot, the line cutting through the box is the median, and the outline of the box the middle 50% of all numbers in the group. The box then includes the middle quartiles. These are the 25% of responses above and below the median.

A weakness of the box plots in this post is they do not include the outer 50% of responses. In this example, we don’t know the least or most number of chicken figurines per household. Instead, we know the “kind of sort of average range even though average is used incorrectly in this sentence.”

In the example provided, of all the people asked how many ceramic chicken figurines they have in their houses, the median is five. Twenty five percent of respondents have between five and nine figurines, and 25% have between three and five figurines.

Disclaimer about the following chart

The information on vacation days that I share below is only meant to inspire curiosity and is not good for any decision making. The information is not disaggregated by organization size or any other identifier—it lumps all organizations together and is based on submissions to date. The data quality has not been validated. Finally, I have not provided any analysis or context.

Minimum and maximum vacation days at different job levels

Respondents were asked to provide the maximum and minimum number of vacation days provided per year at each job level. For example, in one organization, some managers may get as few as 10 vacation days per year, and others get as high as 25 days per year.

This chart shows the ranges provided at the minimum, and the maximum levels.

I only included one plot for ED/CEO because most organizations only have one person in this role, so minimum and maximum numbers are the same.

I didn’t include the VP level because there are too few submissions at this point, and didn’t include Director level because I accidentally deleted a column and didn’t want to go back and fix my work for this teaser blog post. I will definitely be including directors in the report.

Chart of minimum/maximum vacation days per year at each job level. Median numbers are: ED/CEO 20; Manager 15/18.5; Specialist 15/22.5; Coordinator/Assistant 10/15.

This chart shows that the median vacation time for executive directors is 20 days per year. Fifty percent get between 15 and 25 days per year.

For manager roles, the “median” organization provides between 15 and 18.5 vacation days per year. Coordinators and assistants have identical median minimum and maximums. The lower range median for both is 10 vacation days per year, while the upper range median is 15 days per year.

Next week: ED/CEO salaries!

Remember, please share this survey with your professional colleagues who lead nonprofit and charitable organizations. Copy and paste this:

Hi fellow unicorn nonprofit leader:

Have you filled out the Metro Vancouver salary survey yet? It would be great to have current, hyper local data on compensation among our organizations. The survey link and FAQs are here: trinaisakson.com/research.

Metro Vancouver Salary Survey – benefits

Last week I wrote about who was responding to the Metro Vancouver Nonprofit Sector Salary Survey so far. This week…benefits!

nonprofits with benefits

But first…

In order to provide final data on specific types of nonprofits (e.g. based on size, subsector, city) I need a minimum number of organizations (six) in order to assure privacy.

Here are the organization types I’d love to hear more from:

  • Budget size under $100K
  • Budget size $250K to $499K
  • Budget size over $5 million
  • Organizations focussing on environment, health, or sector capacity building
  • Organizations based outside City of Vancouver

I’ve had especially great response from arts organizations with budgets $500K to $999K. Thank you! FAQs and more survey information here.

Reminder: Deadline July 31!

Disclaimer about the following charts

The information on benefits that I share below is only meant to inspire curiosity and is not good for any decision making. The information is not disaggregated by organization size or any other identifier—it lumps all organizations together and is based on submissions to date. The axis scales for each image are not comparable—do not compare the bars in one image the the bars in another. Finally, I have not provided any analysis or context.

Now, let the curiosities begin!

Benefits for all

Top 6 benefits offered to all staff: Flexible schedules, professional development at your office, secure bike parking, extended health/dental benefits, ability to bank time, professional development away from office

Benefits for senior staff only

Opportunities offered to junior staff only were rare.

Top 6 benefits offered to senior staff only: Conference participation, personal days, professional development away from office, extended health/dental benefits, ability to work from home, ability to bank time

Opportunities to ask for more

Top 6 benefits offered on a case-by-case basis: Ability to work from home, mentorship program, conference participation, flexible schedules, professional development away from office, ability to bank timeTop 6 benefits not currently offered, but could be if someone asked: Unpaid leave, personal days, time off for volunteering, compressed work weeks, mentorship program, parental leave top up

Not common

Top 8 benefits not offered: Healthy living allowance, pension, transit pass, parental leave top up, bonus, compressed work week, parking spot, secure bike parking

Before you go, do you mind sharing the survey on LinkedIn, a Facebook group, or other place you connect with nonprofit and charitable leaders?

Metro Vancouver nonprofit and charity leaders–let’s get good, local, current compensation data. Fill out this salary survey by July 31: https://trinaisakson.com/research

Next week….vacation days!

Metro Vancouver Salary Survey – who’s responding so far?

At the request of a few local executive directors, I offered to be the independent, confidential researcher to compile a first Metro Vancouver Nonprofit Sector Salary Survey.

Organizational responses are starting to roll in, and I wanted to give folks a sense of who is responding, and who should be responding.

Deadline for survey responses is July 31.

But first…why a salary survey?

I’ll leave it up to some local executive directors to share why they think it important.

It’s imperative that we leaders of the non-profit sector have access to localized, detailed and up to date data to inform our decisions, budgets and to advocate to government the need for funding.
– David Jordan, Executive Director, Vancouver Fringe Festival

Having current and local data on our sector’s compensation trends, will enable us to work towards equitable and competitive compensation packages. As we strive towards social, environmental and economic justice, this is a critical step forward!
– Dara Parker, Executive Director, Social Venture Partners Vancouver

So who has responded to the call so far?

Smaller arts organizations in Vancouver have been the keenest.

This image show three charts of the cities, subsectors, and budgets of the organizations who have responded so far. Most organizations are based in Vancouver, work in Arts, Education/Policy/Research, or Social Services, and have a budget of $100,000-$249,999.

I hope to see other “groups” of organizations encourage each other to respond to the survey, so that I’m able to release more detailed data in the final report.

My ask of Metro Vancouver nonprofit sector leaders

If you haven’t completed the survey yet, please do!

If you already have, can you encourage 5 other organizations to take part by forwarding this message with some kind words?

Either way, can you share on Facebook and tag other friends in the nonprofit sector? Facebook has been the greatest source of referrals for the survey so far. Example post…

Want to know how your organization’s compensation compares to others in the Metro Vancouver nonprofit sector? Complete this salary survey to help us get better data and make better compensation decisions! https://trinaisakson.com/research

Next week I’ll share some early results on the types of benefits organizations are most likely to provide staff…and benefits that they would consider offering if staff asked!

A Young Nonprofit Professional’s Guide to Vancouver (2016 updated)

New to the Vancouver nonprofit scene? Young in age or young in career? Here are some places for you to get yourself started.

Careers

Volunteering

Learn and network in person

Learn online

Formal learning

Blogs and news

Mentorship Programs

07 Jimmie Briggs on self care

Jimmie Briggs

In this episode of the Do Good Better Podcast I chat with Jimmie Briggs, author, speaker, and nonprofit leader about self care and the lessons he finally learned after a heart attack and kidney transplant.

Links for today’s episode: